Vercel Introduces Tree and Waterfall Views for Application Performance Tracing
Vercel has added native tree and waterfall views to its tracing interface, enabling developers to better visualize operation hierarchies and latency bottlenecks.
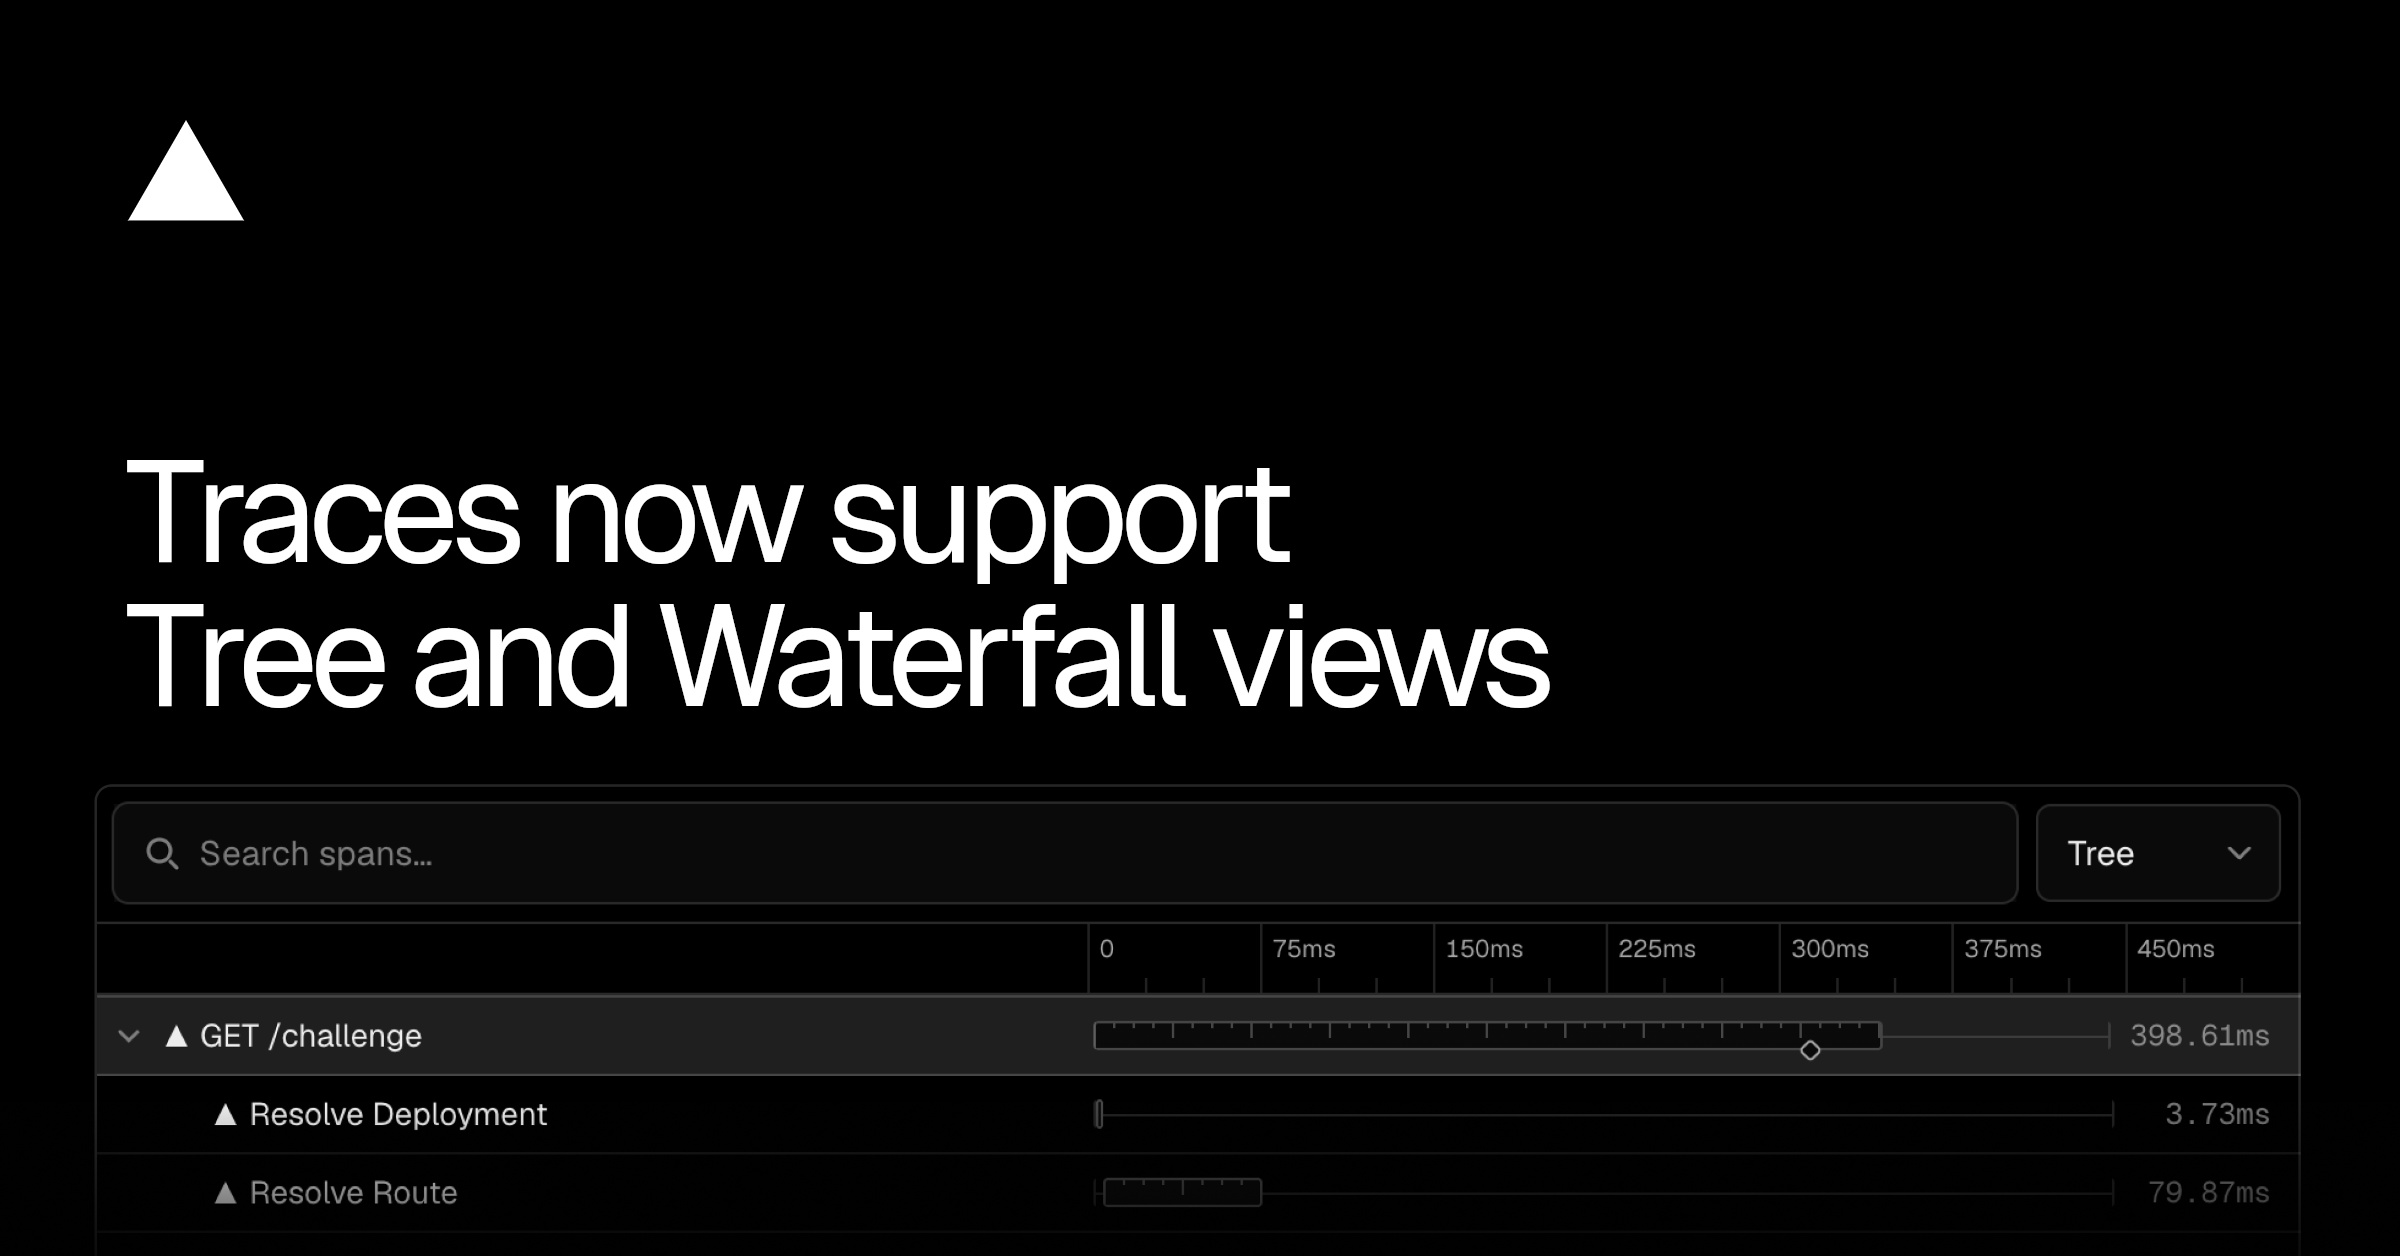
Vercel has updated its application monitoring capabilities by introducing tree and waterfall views for trace data. This update allows software engineers to analyze request flows, inspect parent-child execution structures, and pinpoint precise sources of latency within their serverless and edge operations. The visualization tools help debug cold starts, database query overheads, and downstream API bottlenecks directly within the Vercel dashboard.
Primary source
Open Vercel Changelog ↗This article summarizes the source. Check the original for full details and conditions.
Comparison
| Aspect | Before / Alternative | After / This |
|---|---|---|
| Trace Visualization | Flat or standard list views of operation spans | Hierarchical tree and waterfall timeline views |
| Bottleneck Identification | Manual analysis of timing timestamps per span | Visual representation of overlapping and blocking spans |
| Debugging Context | Difficulty trace-linking parent-child execution paths | Clear structural hierarchy showing parent-child relationships |
Action Checklist
- Access the Vercel dashboard and navigate to your project monitoring section Ensure your project has active deployment analytics enabled.
- Inspect recent performance traces to view the new tree visualization Look for nested serverless function calls to verify hierarchy representation.
- Utilize the waterfall timeline to identify blocking synchronous operations Check for parallelizable asynchronous tasks that are currently executed sequentially.